Data monitors
The Data monitor field creates a special kind of observation that collects data automatically from a source —a sensor, a device or a web service— that sends information periodically and repeatedly. Peneira stores the full history of measurements and shows it as a chart or a table, even after you close the application.
It is useful for weather stations, environmental sensors, greenhouses, aquariums, Arduino, ESP32 or micro:bit devices, and for any web service that returns numeric data in JSON format.
Who configures each part?
- Teachers add the Data monitor field to the category and write its name and description.
- The person creating an observation configures the actual source, the values to collect, the units and the duration. The frequency is only configured when Peneira polls a web source.
- Anyone with access to the published observation can view the charts and the table.
- A device's POST address and token are private: only the observation's author, the project teachers and the administration can see them.
How will the data arrive?
When you reach the Data monitor field you must choose one of the two modes.
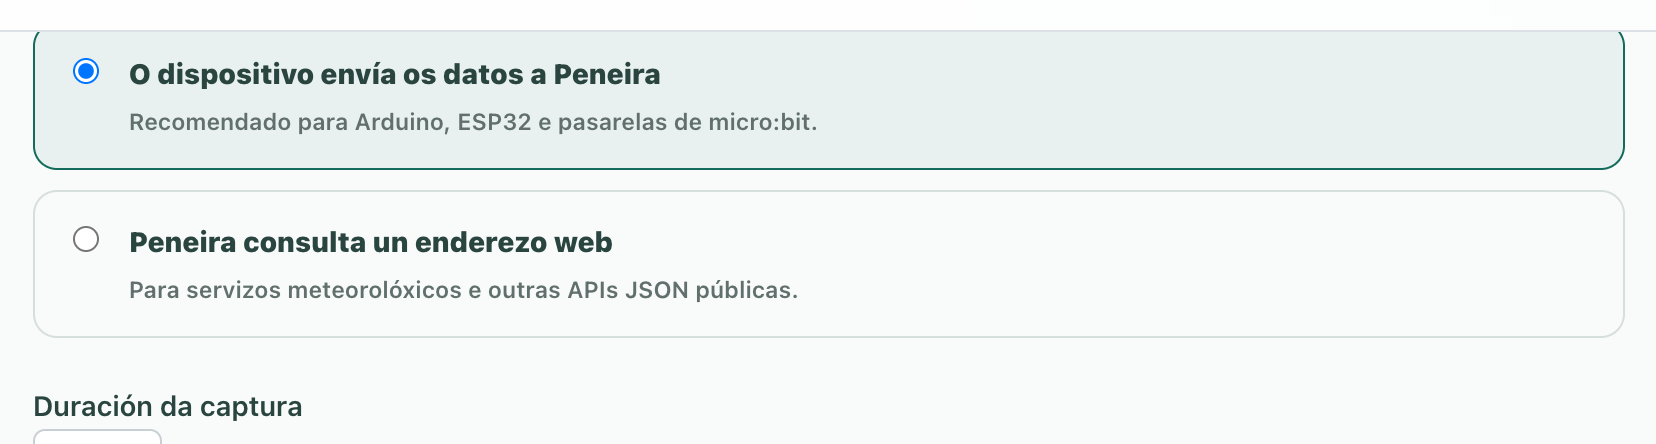
Peneira receives data from an external device (push mode)
Choose this option for an Arduino, ESP32, a micro:bit with an internet gateway or any other device able to make HTTP requests.
- Set the capture duration. A value of
0means there is no end date. - Define the values, JSON paths and units you want to collect (you can add between 1 and 12).
- Press Get URL and token to see the POST address, the private token and an example of the JSON the device must send.
- Save these details in the device configuration and create the observation.
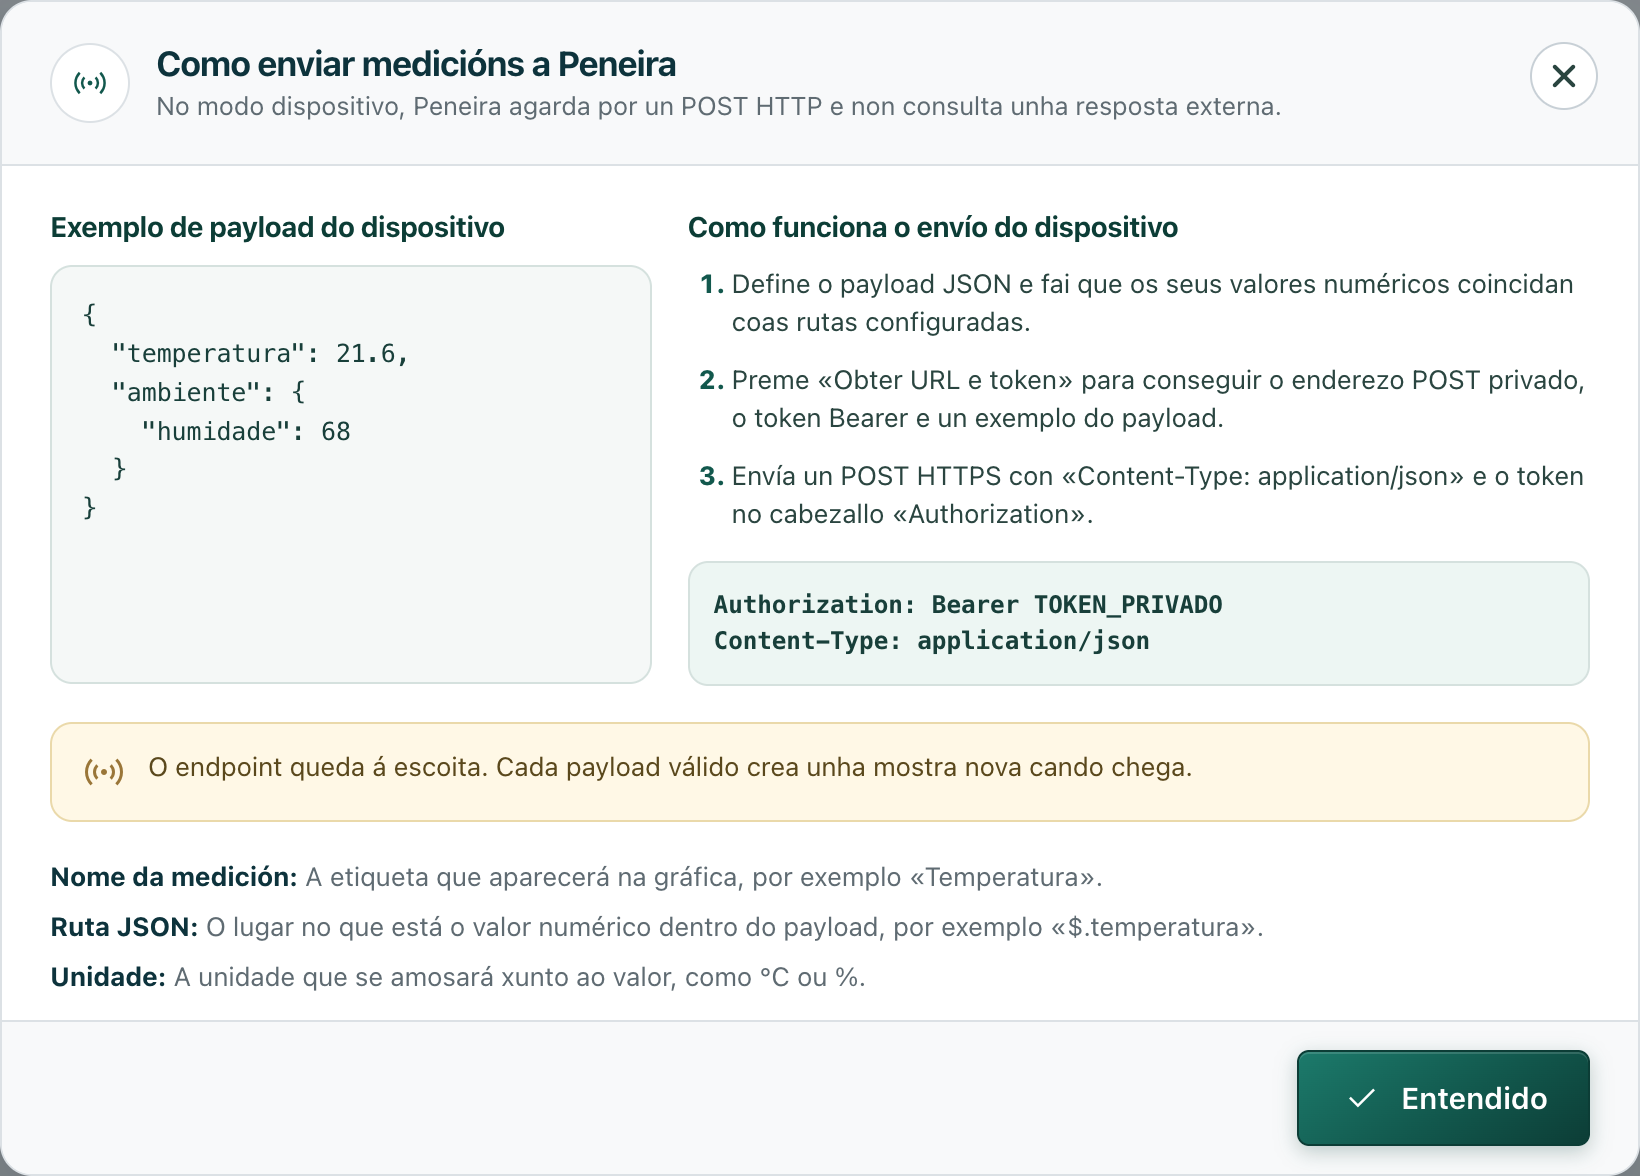
Peneira does not poll the device or impose a frequency on it: the address stays listening and stores every submission as it arrives.
If you have doubts about the format, press How does it work? to see an example payload and the exact steps.
When you press Get URL and token, Peneira shows the POST address, the private token and an example JSON body:
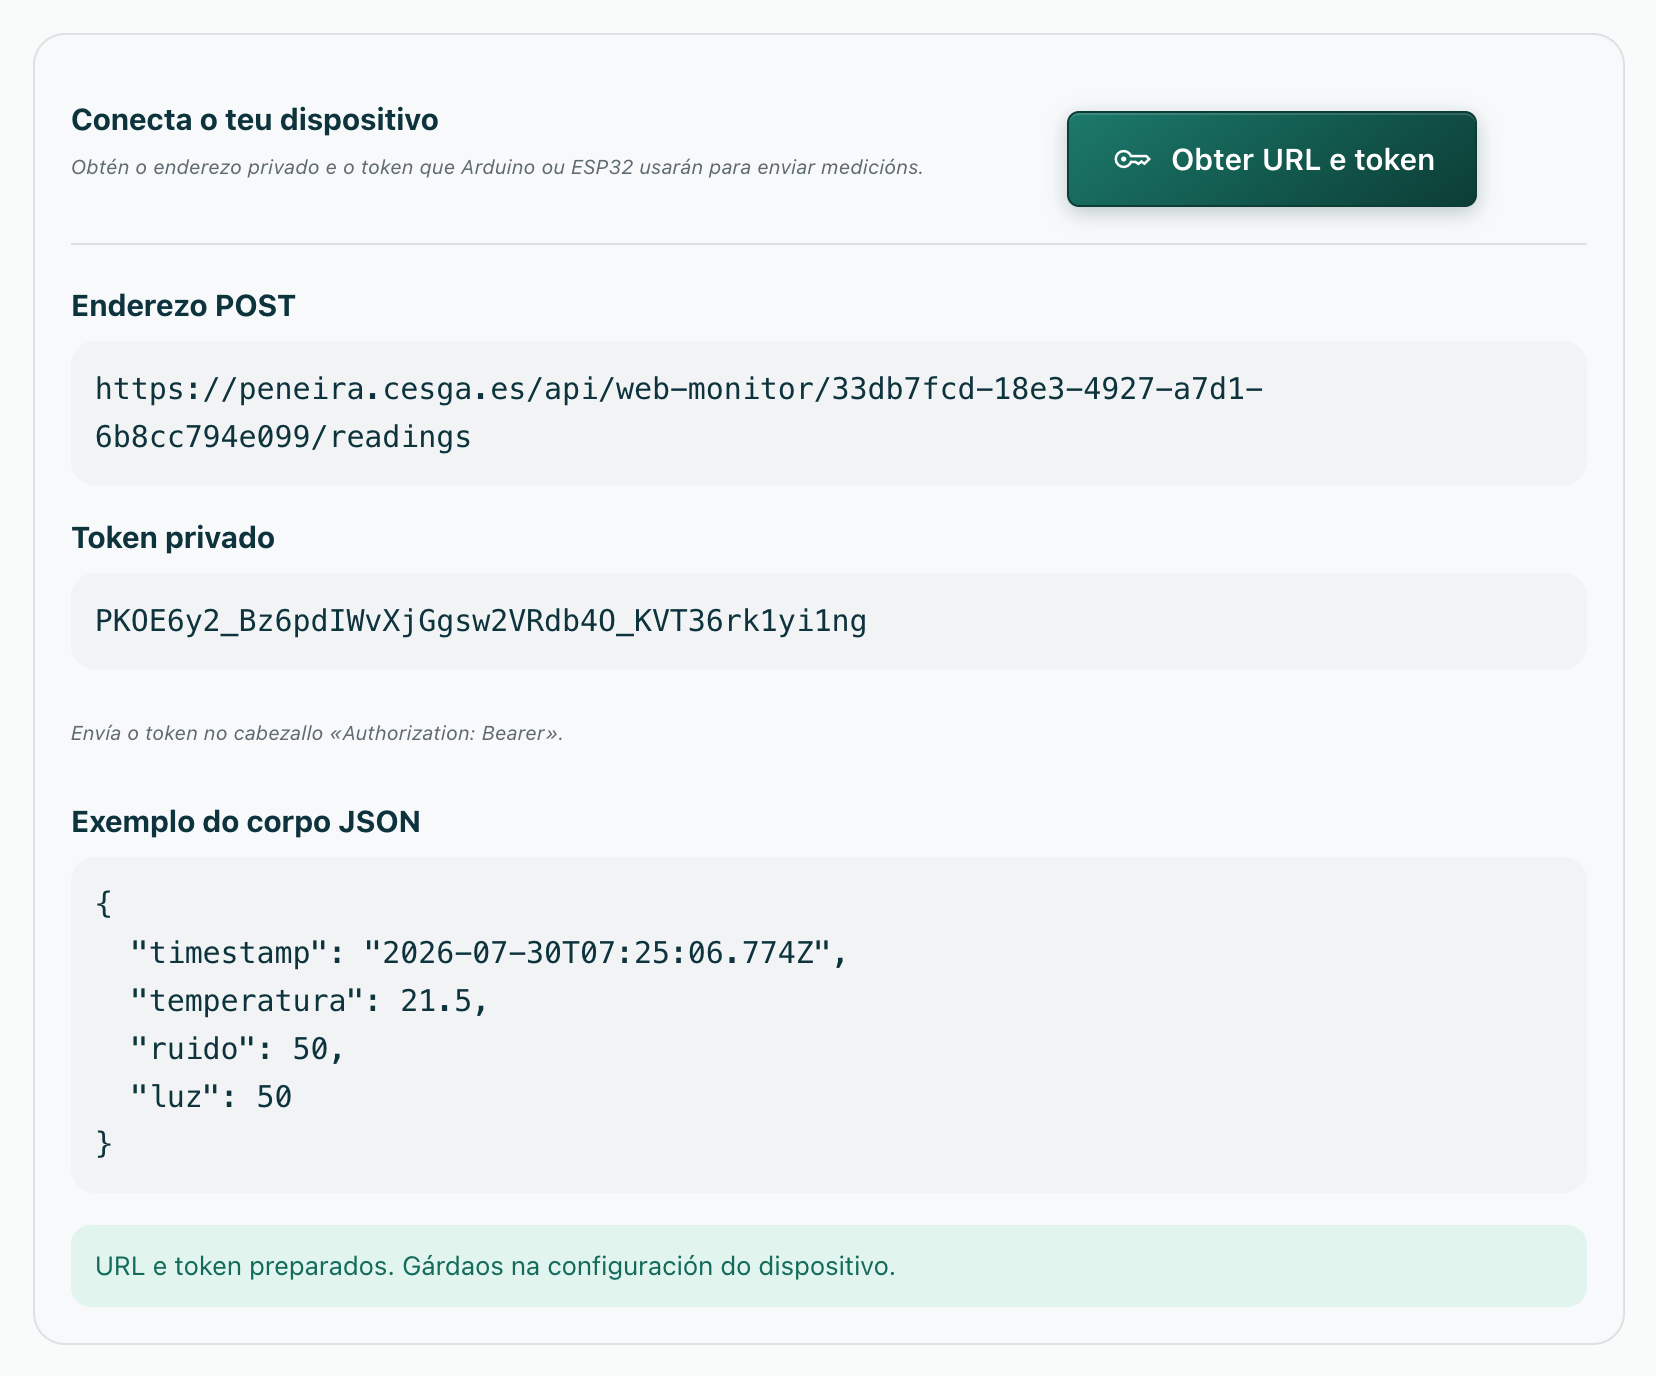
The token is sent in the HTTP header:
Private credentials
Do not share the token or publish it in source code. Peneira shows it during configuration so you can save it straight into the device. It does not appear again after the observation is created.
Peneira connects to a web service (pull mode)
Choose this option when a public API already exists, for example a weather service.
- Enter an
https://address that returns a JSON object. - Choose the capture frequency (between 5 minutes and 7 days).
- Set the capture duration.
- Define the values Peneira must extract.
- Use Test connection to check the response before creating the observation.
For security, the URL cannot point to localhost, to a private network, or include a username and password. Only HTTPS is allowed and redirects are not followed.
AI field suggestions
If the administration has configured an LLM provider, signed-in users will see the Detect fields button next to the connection test (pull mode only). Peneira polls the source first, locates its numeric values and proposes names, JSON paths and units. Suggestions can be reviewed and selected before adding them; they are never applied automatically.
To protect privacy, Peneira does not send the model the source URL, credentials, session data or the full JSON response: only a limited list of numeric paths and their sample values.
How to select values from a JSON
Each measurement has three details:
- Measurement name: a readable label that appears on the chart, for example
Temperature. - JSON path: where the number is located inside the response.
- Unit: text shown next to the value, for example
°C,%,ppmorlux.
Paths start with $.. Suppose the source returns:
{
  "temperature": 21.6,
  "ambient": {
    "humidity": 68
  },
  "sensors": [
    { "name": "outdoor", "value": 18.4 },
    { "name": "classroom", "value": 22.1 }
  ]
}
| Desired value | JSON path | Result |
|---|---|---|
| Temperature | $.temperature |
21.6 |
Humidity inside ambient |
$.ambient.humidity |
68 |
| First sensor value | $.sensors[0].value |
18.4 |
| Second sensor value | $.sensors[1].value |
22.1 |
Lists start at zero
In a JSON list the first element is [0], the second is [1], the third is [2], and so on.
Peneira only plots points for numeric values. If a path does not exist in a given response, that measurement stays empty for that sample and the rest keep being stored.
Measurement date and time
Peneira uses the moment it receives or polls each measurement as its date and time. This avoids misinterpreting local times, partial dates or other time fields in the response.
Viewing the data
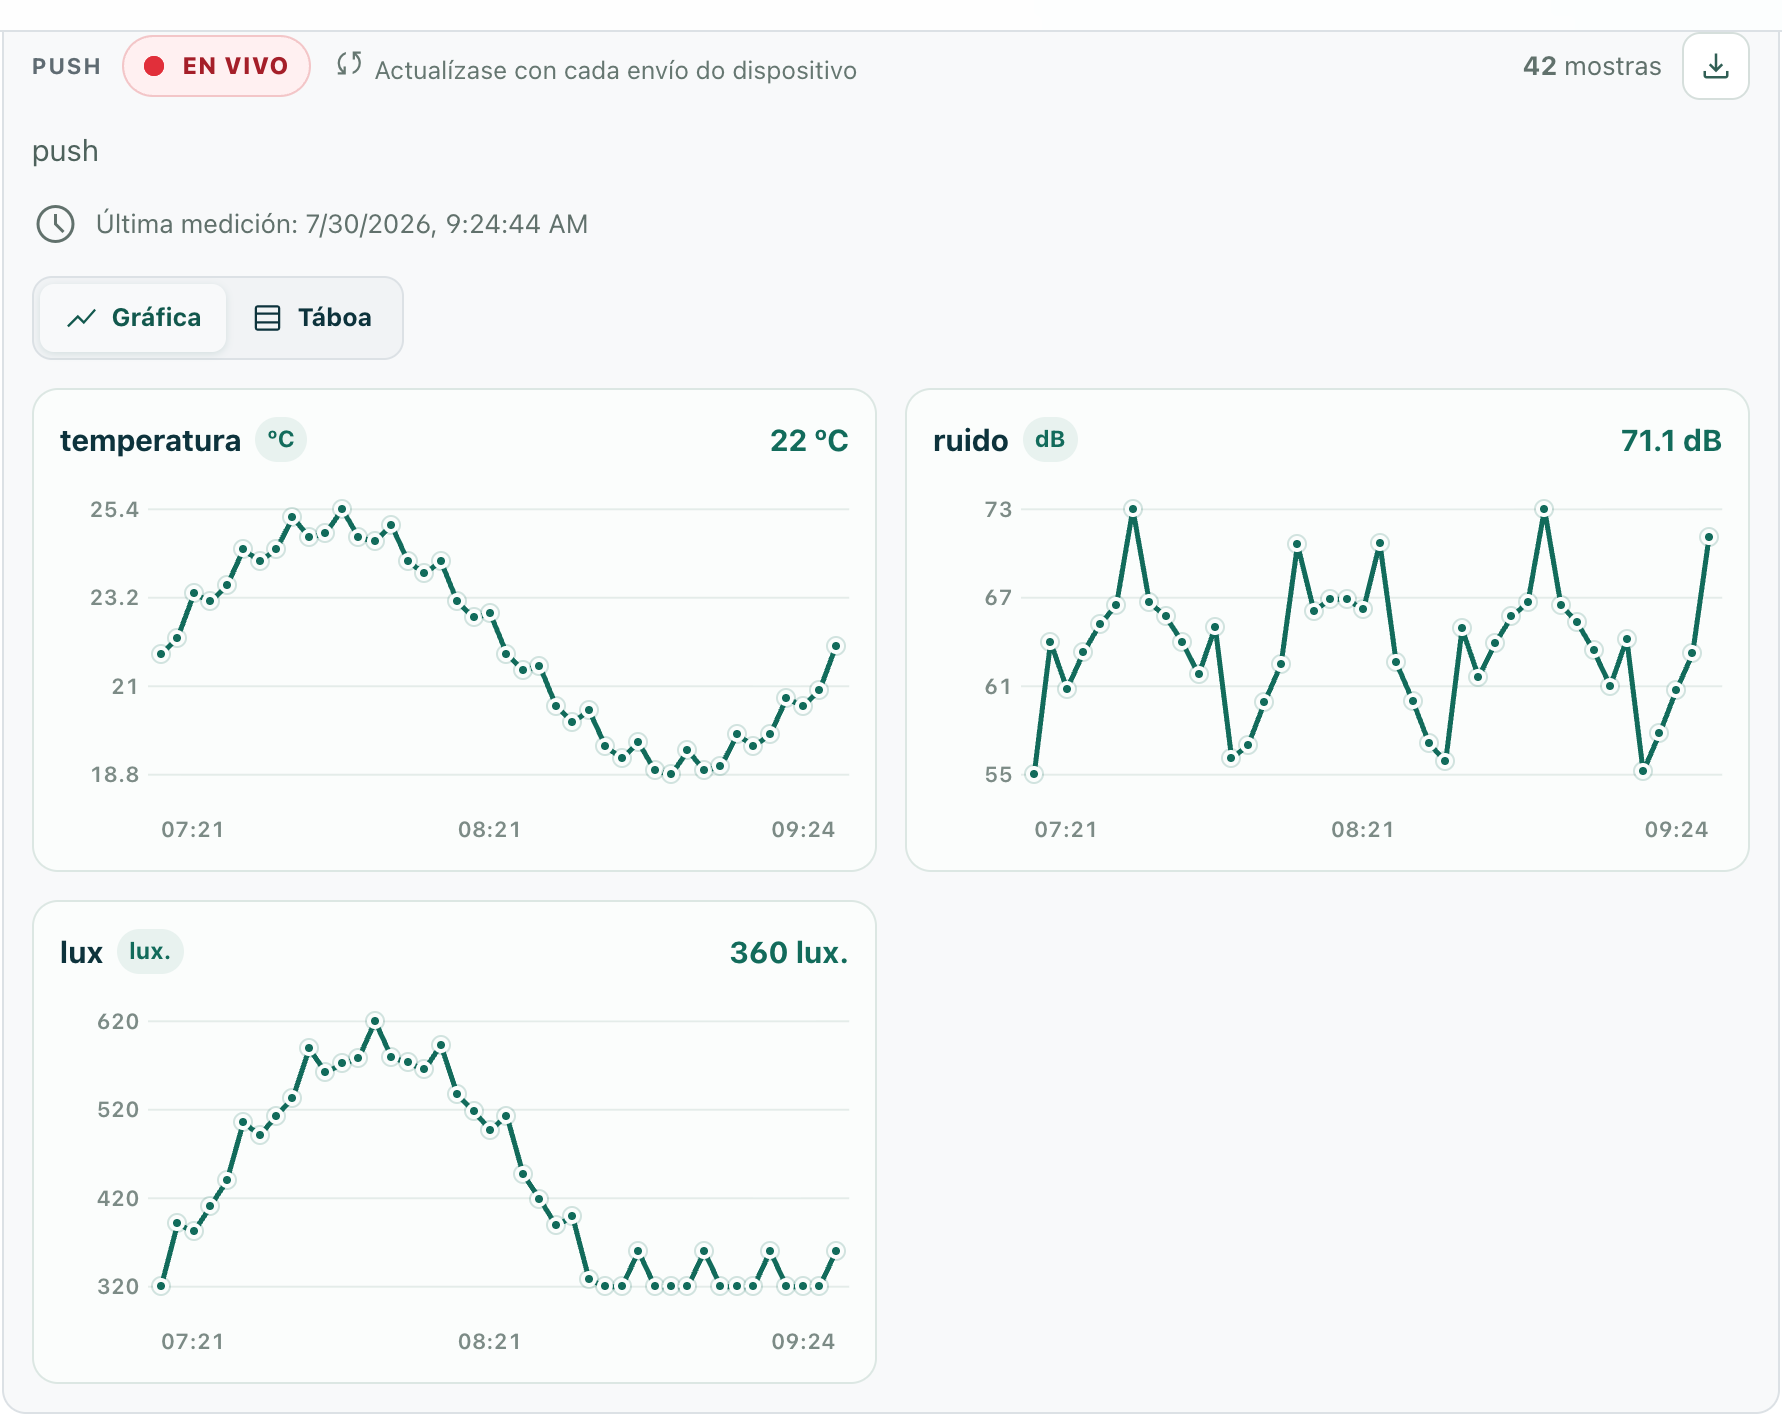
An active observation shows:
- a LIVE indicator and the refresh frequency;
- the last measurement received;
- the number of samples;
- one chart per value, with its unit and with values on the axes;
- an alternative Table view;
- a CSV download of the data for users with access.
Press Table to see every sample as rows, with the date and time of each one:
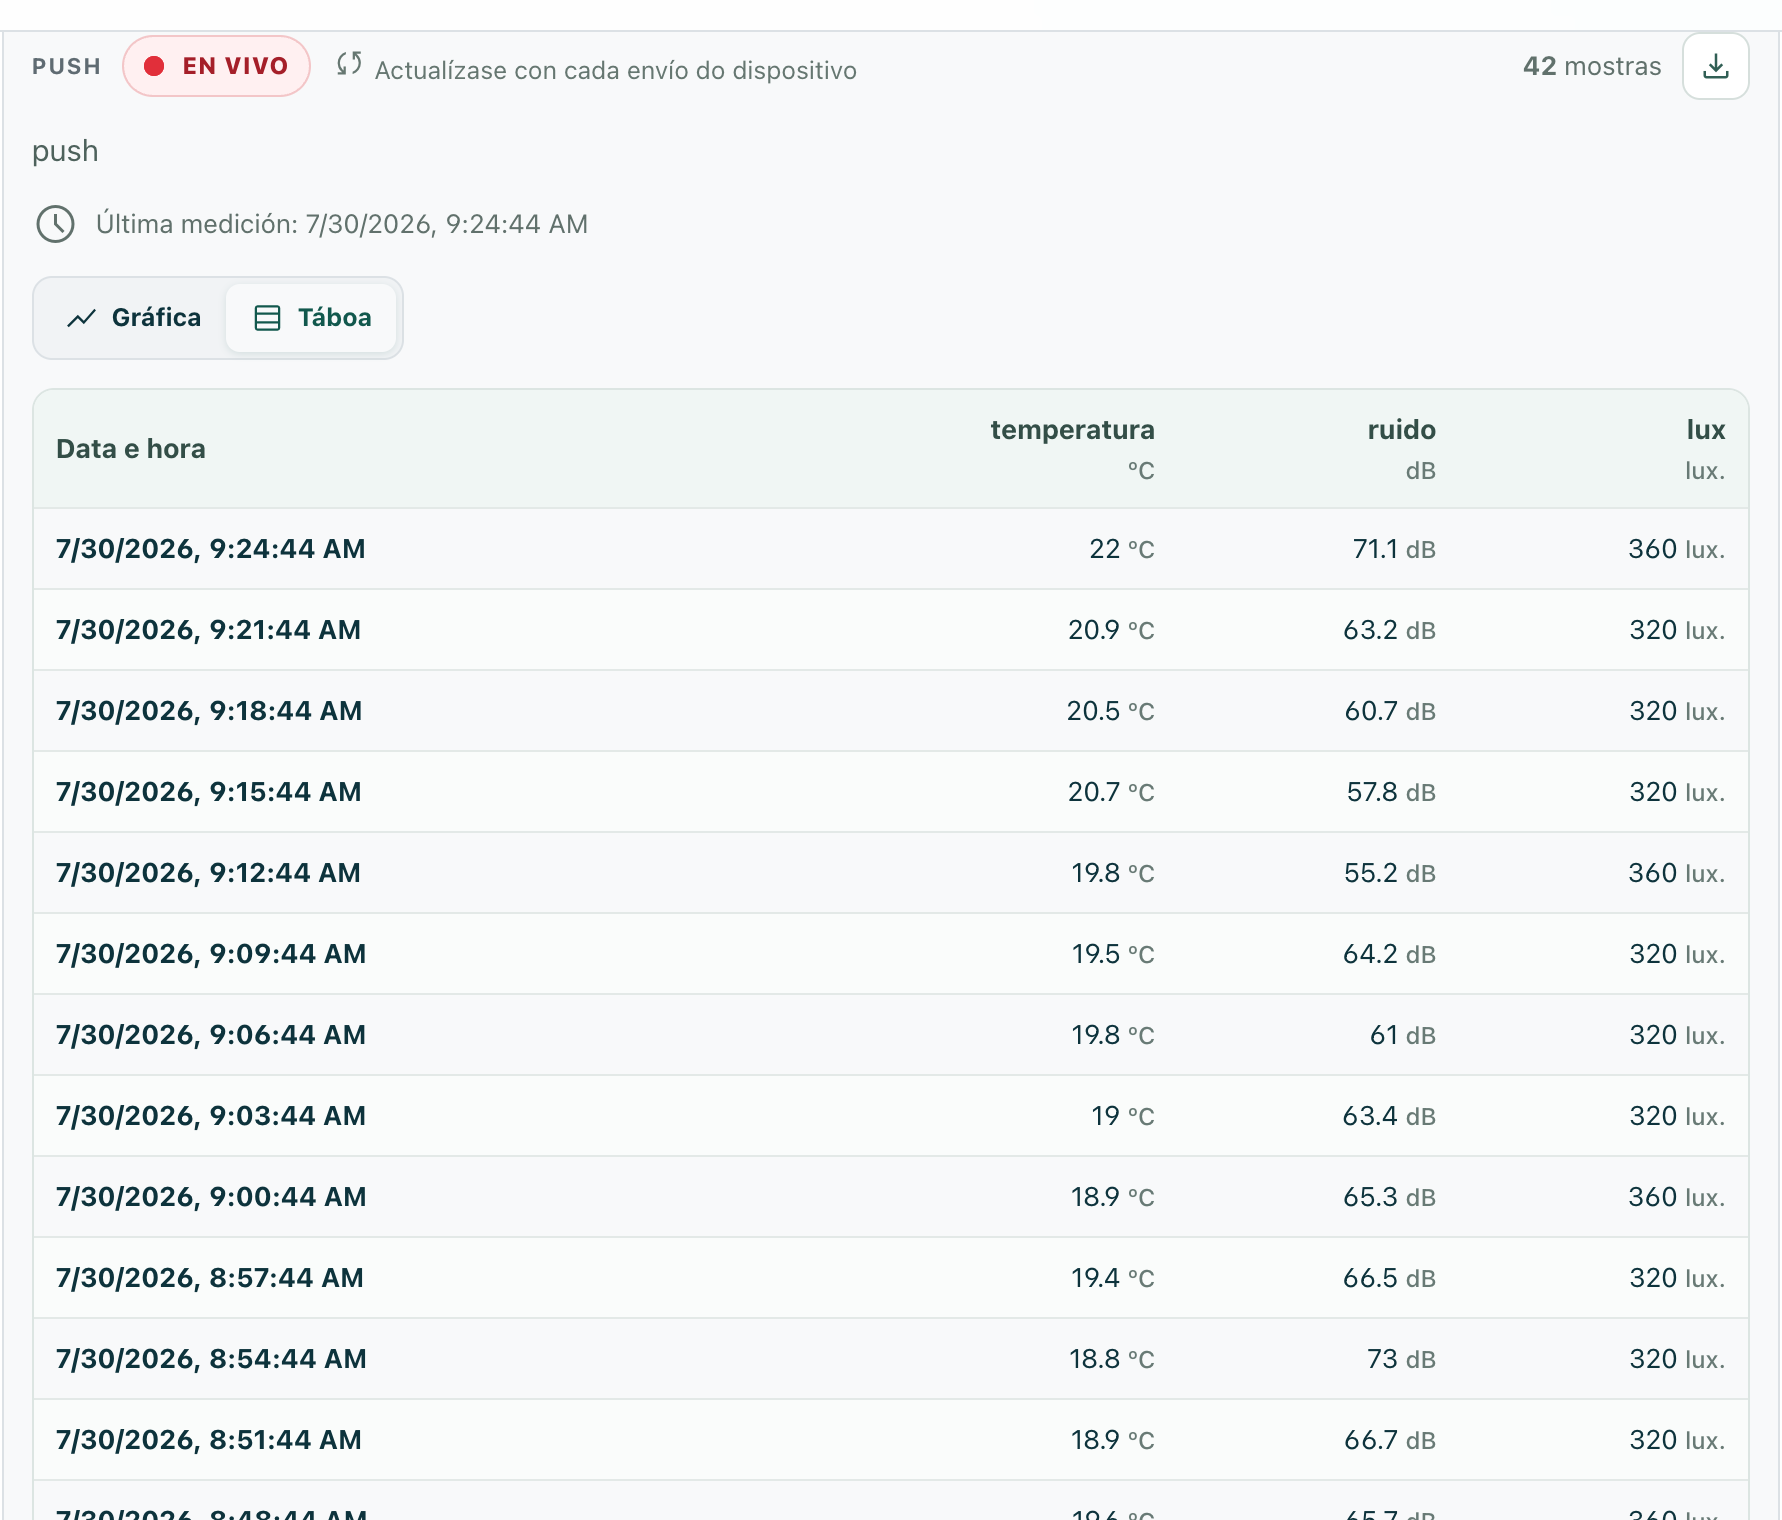
The monitor keeps running on the server even if Peneira is closed. If the observation needs moderation, capture starts when the teachers approve it.
While the observation is open and visible, the data refreshes automatically without pressing F5: roughly every 5 seconds for monitors a device sends data to, and every 15 seconds for web sources. If you switch to the table view, Peneira keeps that view as new samples come in.
Full example: a micro:bit V2 sending data to Peneira
In this guide the micro:bit measures temperature, noise and light and, when you press button A, sends them to a Peneira push monitor.
The micro:bit has no WiFi
A micro:bit V2 cannot make HTTP requests on its own. That is why the board writes each measurement to the USB serial port and a small program on the computer (the gateway) forwards them to Peneira with the private token. As long as the gateway is open and the board connected over USB, the data arrives on its own when you press the button.
You need:
- a micro:bit V2 board and a USB cable;
- a computer with Python 3;
- the example files:
- peneira-microbit-v2.hex — the program ready to flash onto the board;
- peneira_gateway.py — the computer gateway;
- main.ts — the source code, in case you want to modify it in MakeCode.
1. Flash the program onto the micro:bit
- Connect the micro:bit to the computer with a USB cable. It will appear as a drive called MICROBIT.
- Download peneira-microbit-v2.hex and copy it into that drive. The board blinks while flashing and shows a ♥ when finished.
Every time you press button A, the program does the following:
temperatura: the chip's internal temperature, in °C.ruido: the microphone level converted to an approximate value in dB.luz: the LED matrix light level converted to an approximate value in lux.
Approximate values
The micro:bit is not a sound level meter or a lux meter. The ruido and luz values are estimates from its built-in sensors; if you need accurate measurements, adjust the conversion in the source code or use calibrated sensors.
2. Configure the Data monitor field
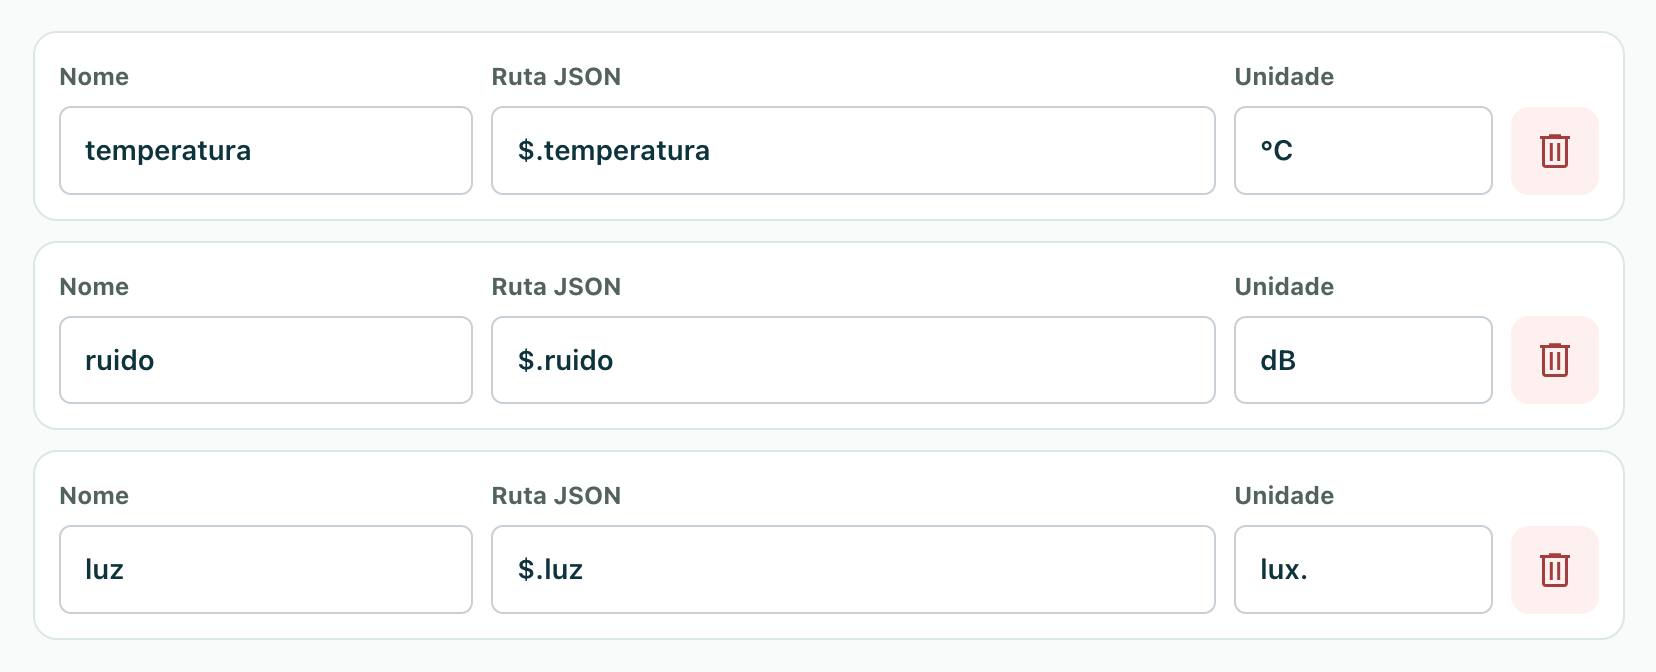
In the observation, choose The device sends the data to Peneira and add these three values:
| Name | JSON path | Unit |
|---|---|---|
| temperatura | $.temperatura |
°C |
| ruido | $.ruido |
dB |
| luz | $.luz |
lux |
Set the duration to 0 (no end date), press Get URL and token and save the POST address and the token: you need them in the next step.
3. Run the gateway on the computer
The gateway reads what the board writes to USB and forwards it to Peneira.
-
Install the dependency (first time only):
-
Download peneira_gateway.py and give it your address and token. You can use environment variables:
export PENEIRA_MONITOR_URL="https://peneira.cesga.es/api/web-monitor/YOUR_ID/readings"
export PENEIRA_MONITOR_TOKEN="YOUR_TOKEN"
python3 peneira_gateway.py
…or pass them as arguments:
-
The gateway detects the board automatically. When you press button A, you will see something like:
In Peneira, the observation will show LIVE and new samples will appear on the chart without reloading the page.
Check first without sending anything
Run python3 peneira_gateway.py --dry-run to see the measurements in the terminal without sending them to Peneira. It is useful for confirming that the board and cable work.
Troubleshooting
| Message | What it means | What to do |
|---|---|---|
Non se atopou ningunha micro:bit |
The gateway cannot see the board. | Check the USB cable or set the port with --port /dev/.... |
Non se puido abrir ... |
Another program is using the port. | Close the MakeCode editor or any open serial monitor. |
token non válido (401) |
The token does not match. | Copy the token again with Get URL and token. |
demasiado rápido (429) |
More than one measurement per second. | Wait a moment between button presses. |
o monitor xa non acepta medicións (410) |
The capture duration is over. | Create a new observation or increase the duration. |
Glossary
- Data monitor: an observation that keeps receiving measurements over time from an automatic source.
- push (Peneira receives data from an external device): the device makes the request and sends the data to Peneira whenever it wants. Peneira just listens.
- pull (Peneira connects to a web service): Peneira connects periodically to a web address and reads the data.
- endpoint: the web address the device sends each measurement to, using an HTTP POST request.
- payload: the data the device sends in each request, in JSON format.
- token / Bearer: a secret key that authenticates the device's submissions; it travels in the «Authorization: Bearer» header. Do not share it.
- JSON path: tells Peneira where each value is inside the JSON; it starts with «$.», for example
$.temperatura. - HTTPS: the secure, encrypted version of the web protocol. The address Peneira gives the device always uses HTTPS.
- measurement / sample: each set of values received at a given moment.
Recommendations
- Use short, clear names:
Temperature,Humidity,CO₂. - Always include the unit.
- Test the web source first (pull mode) or use
--dry-run(push mode). - Do not poll an API more often than necessary.
- On devices, keep the token out of any code you publish.
- Make sure the values sent are numbers and that the JSON is valid.