Download and process data
Once participants start collecting data in your project, you can visualize or download it at any time. There are different ways to view the data collected in your project:
- From the map view
- By individual creator (user)
- Latest observations
All of them are accessible from the project's main page, below the categories section.
Observations on the map
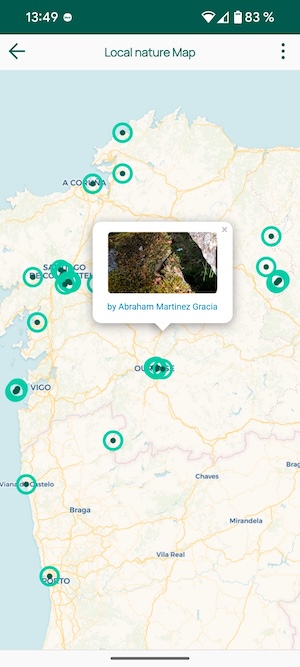
When you open the map, you can tap each point to see the data captured in each observation made. Use your fingers to zoom in and out or move the map.
Exporting the map as an image
Project and category maps provide an Export map as PNG button. Peneira creates a high-resolution image (1600 × 1004 pixels) and automatically adjusts its centre and zoom level to include every geolocated observation.
The image includes the project or category name, the number of geolocated observations, the base map, and all markers without clustering. The export uses whichever standard or satellite base map is selected. Category exports also include custom URL-based tile layers when their server allows them to be exported. MBTiles maps remain available in the interactive view but are not included in the PNG image.
If no observations have valid coordinates, the button is disabled. Only published observations visible to the person viewing the map are included.
My observations
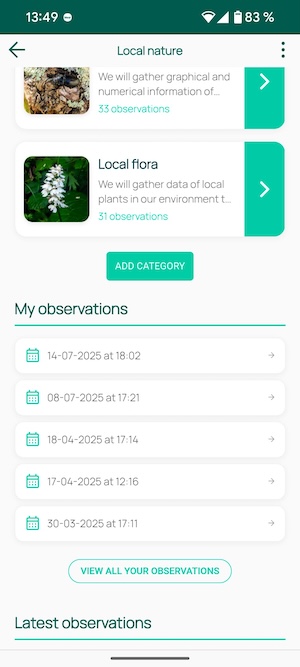
When you open the map, you can tap each point to see the data captured in each observation made. Use your fingers to zoom in and out or move the map.
Latest observations
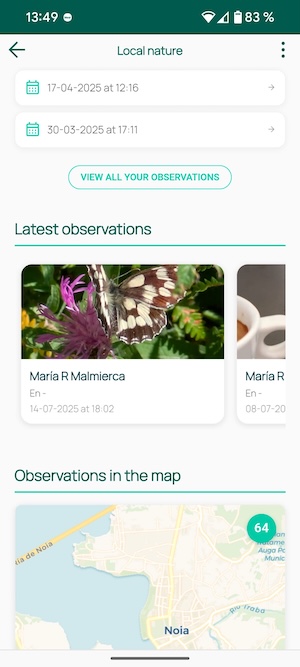
Below "My observations" there is a feed with the latest observations made in the project, for easy access.
Observations by user
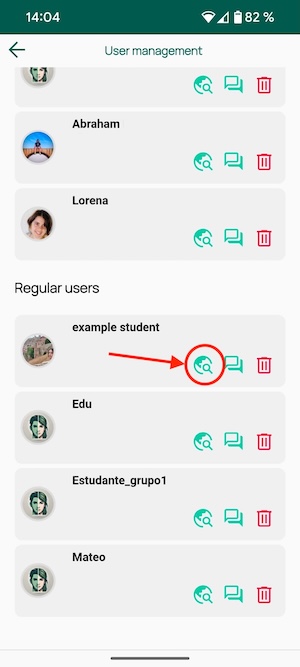
As an administrator, you can also view individual contributions to your project. Go to the "User management" section and click the "Globe" icon located to the right of the user's name.
Export / download observation data
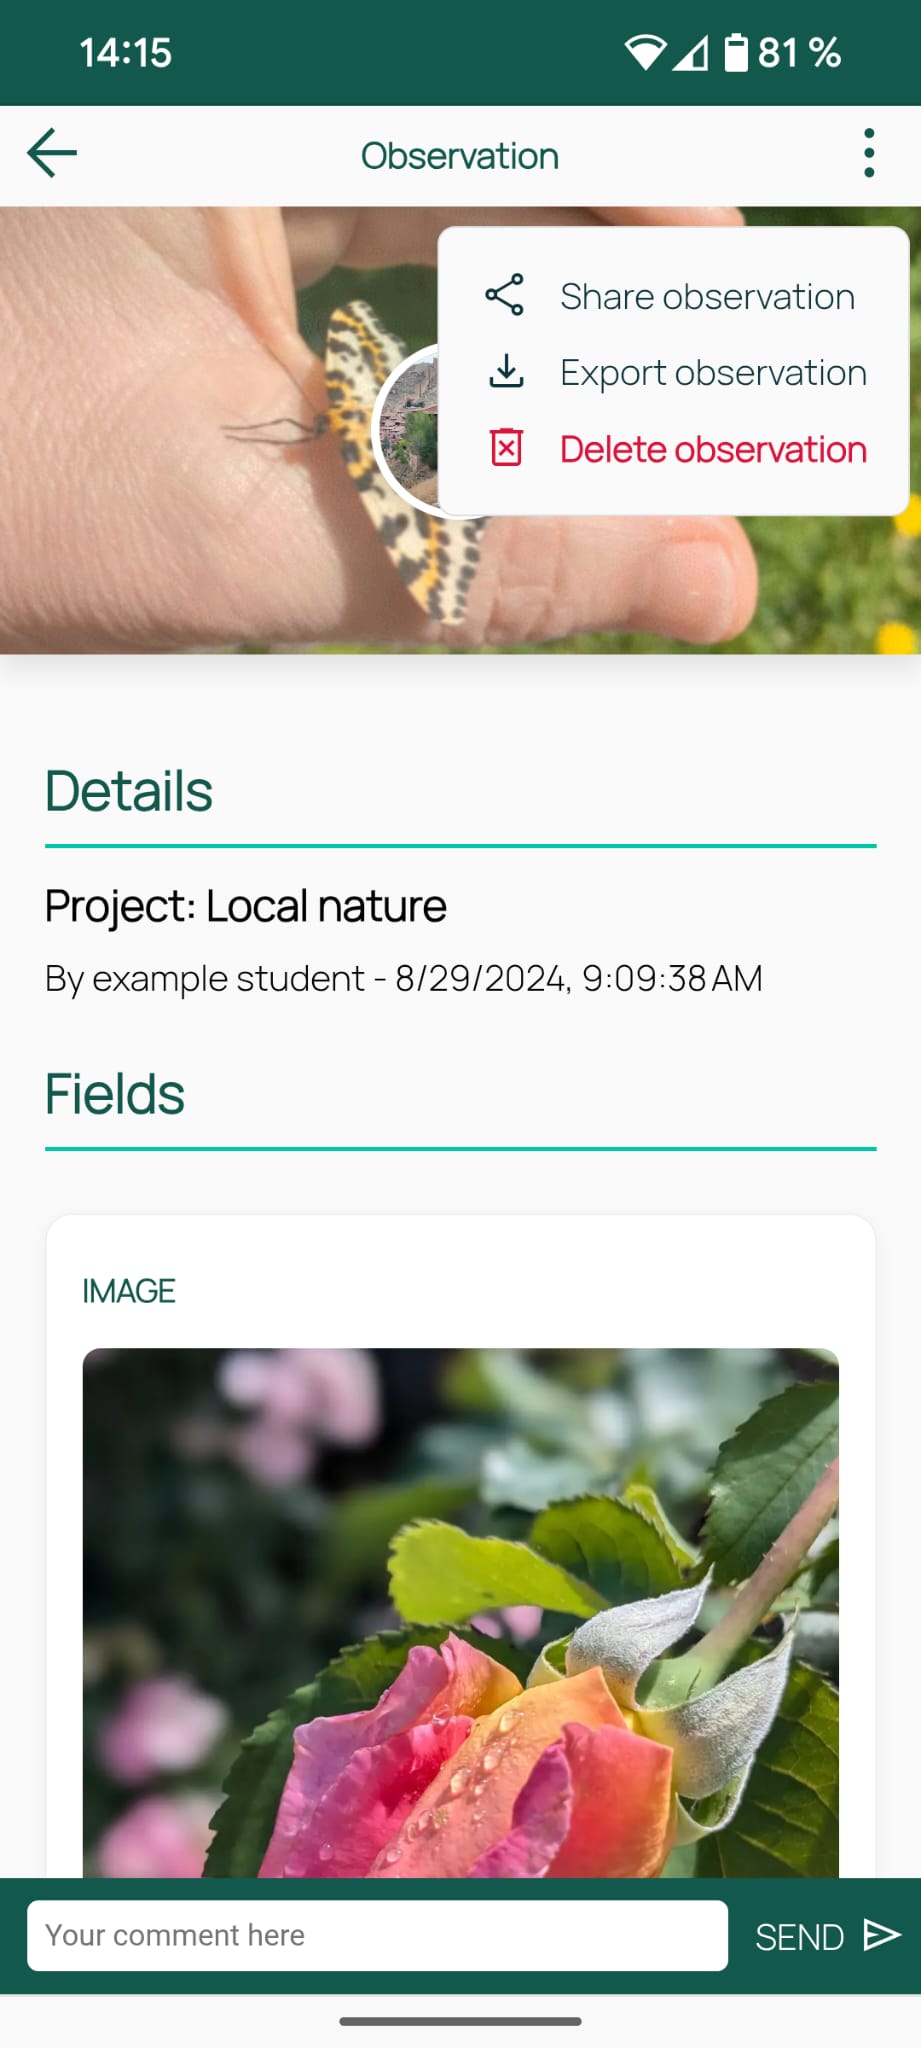
Once observations are captured, their data can be exported in different formats. To do so, open the observation and click the 3-dot menu in the top right corner and select the "export observation" option. When you select the option, you will have to choose the format you want to use to display the data (json, csv, or geojson).
Editing an observation
The author of an observation can open it, select the three-dot menu and choose Edit fields. Text, number and selection fields can be changed, multimedia content can be replaced, and the category and capture date and time can be adjusted.
When Save is selected, Peneira uploads any new multimedia files first and then updates the observation. A notice confirms that the operation completed successfully before the page refreshes. If the server cannot find or save the observation, an error notice is displayed and edit mode remains open.